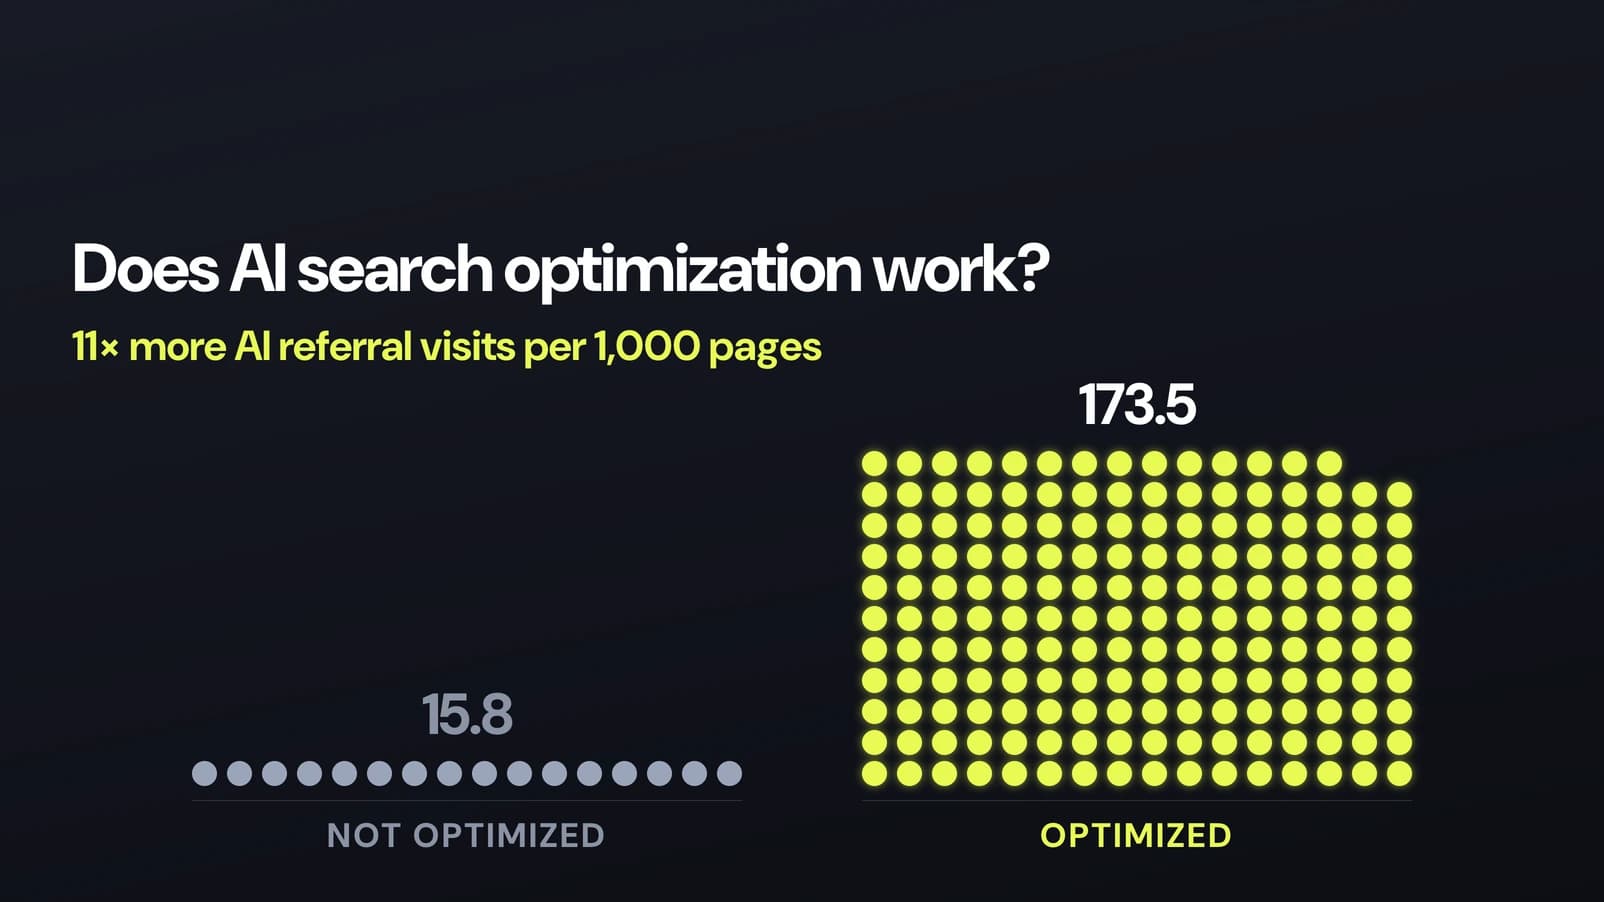
Does it work?
AI search optimization sounds reasonable in theory. Add structured data, lead with the answer, cover your niche in depth, and AI engines are more likely to recommend you. But does it change anything you can measure? Or is it SEO advice with a new acronym?
Our data says it's real and meaningful. Across 116 WordPress sites and 108,834 pages, optimized pages earned 173.5 AI referral visits per 1,000 pages over 90 days. Untouched pages sitting on the same websites earned 15.8. That is 11 times the traffic per page, and optimized pages came out ahead on 89 of the 102 sites that saw any AI traffic at all. On thin, low-priority pages the effect disappears completely.
The rest of this article is how we got there and where the result stops holding. We are in an unusual position to run this test, because we track the full journey from AI crawl to referral visit across more than 1,100 WordPress sites. The sample, the definitions, the window and the known weaknesses are all below, so you can argue with it rather than take our word for it.
Our window is 90 days, and that length is not arbitrary. AI bots re-crawl a changed page within hours to days, so the technical work gets picked up almost immediately, but the traffic that follows accumulates slowly: a page has to be re-crawled, then retrieved to answer a live question, then actually clicked. A month is mostly noise. At 90 days both groups had settled into a stable pattern, though rates were still climbing when we closed the window, so treat this as a floor rather than a ceiling.
What "optimized" means in AI search optimization
When we say a page is optimized, five things must be true.
- The page carries complete, nested JSON-LD structured data, so a model can confirm what the page is, who published it and what it covers without inferring any of that from layout.
- Its headings are rewritten as the questions they answer. Its body copy is reordered to lead with the answer instead of building up to one.
- A short summary is added near the top. A FAQ block is generated, both visible on the page and in schema.
- Meta titles and H1 tags are rewritten.
- And the site ships an llms.txt file telling crawlers what the site is for and which pages matter.
One structural detail matters for reading the results. The plugin does not edit the live page. It builds a separate, AI-readable copy and serves that to bots, while human visitors get the original untouched. So "optimized" and "untouched" describe what a crawler receives, not two versions of a page that a customer rewrote by hand. Nobody in this dataset changed their copywriting. That is what makes the comparison clean, and it is why the treatment is consistent across every site in the study.
Every optimization here ran at the same level, the plugin's standard setting, so as not to introduce additional variables and keep the results focused. We are not comparing effort levels or budgets.
How does the AI funnel actually work?
Getting crawled and getting recommended are separated by about three orders of magnitude, and the gap is where all the work is. Between 1 January and 26 July 2026, across the sites we track:
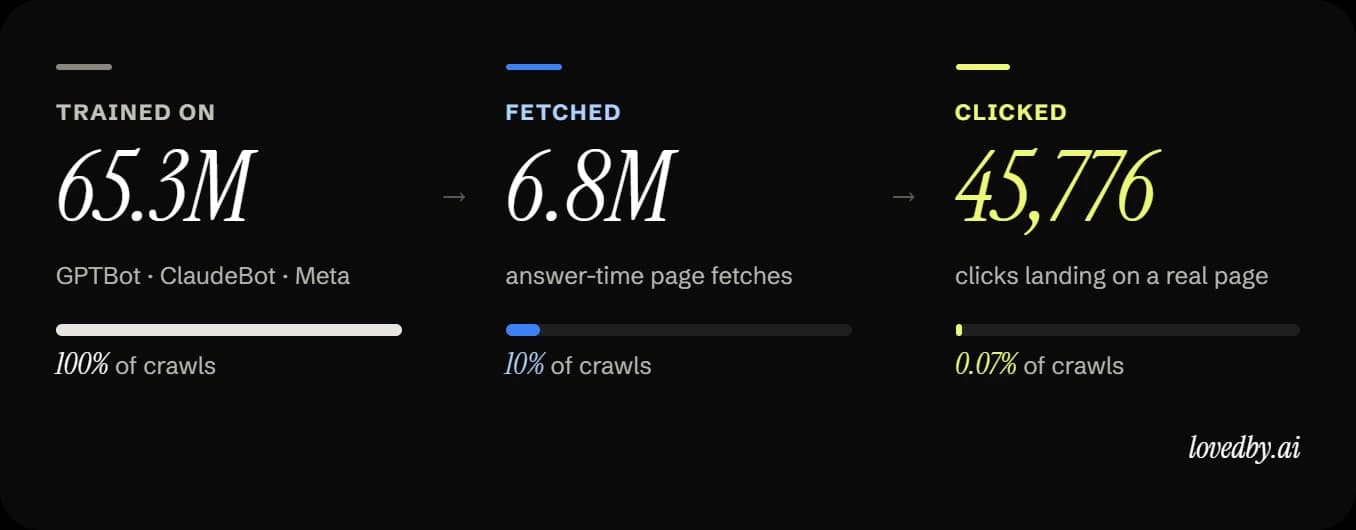
One visitor for every 1,400 training crawls. One visitor for every 148 answer-time fetches. Only 0.67% of the times a model fetched a page to answer a question did that produce a click.
Crawling is free and nearly universal, so it tells you almost nothing about how you are doing. What matters is moving a page out of the crawled-and-ignored majority into the small set a model retrieves and credits.
Crawl volume tells you nothing about which engine sends traffic
Rank these four engines by how much of your content they take and you get almost exactly the wrong answer about which ones matter.
| Engine | Pages crawled | Visits sent | Visits per million crawls |
|---|---|---|---|
 ChatGPT ChatGPT | 27.7M | 39,717 | 1,435 |
 Claude Claude | 15.0M | 1,495 | 100 |
 Gemini Gemini | 1.8M | 3,113 | 1,761 |
 Perplexity Perplexity | 0.6M | 1,452 | 2,269 |
Perplexity crawls the least by a wide margin and returns the most traffic per page it takes. Claude does the opposite: ClaudeBot is the second-heaviest crawler here at 15 million pages, and Claude returns 100 visits per million crawls, roughly a fourteenth of ChatGPT's rate and a twenty-third of Perplexity's.
Two more crawlers are worth knowing about even though they are not in the table. Meta and Amazon took 25 million pages between them over the same period and sent back nothing at all. Neither runs an assistant that links out to sources, so a per-crawl rate for them would just be zero.
None of that changes where the traffic is. ChatGPT is the market, at 86.8% of every AI referral visit we recorded over eight months. Gemini takes 6.8%, Claude 3.3%, Perplexity 3.2%. Perplexity's efficiency per crawl is real and also nearly irrelevant to your traffic, because it operates at a fraction of the scale.
That figure is worth checking against people who are not us, because it is the number most likely to be quoted. Conductor's 2026 benchmark puts ChatGPT at 87.4% of AI referral traffic, within a point of ours. Previsible reads it higher at 92.4%, SE Ranking lower at 74.8%, and Goodie lower still at 62.6% on a B2B-only sample where Claude reaches 18.5%. Our 86.8% sits in the middle of that range, and the spread is a fair warning that the exact figure depends on whose sites you measure. Ours are mostly small and medium businesses on WordPress. If you want the split for your own site, it is worth tagging AI traffic properly, because most analytics setups quietly file these visits under direct traffic.
How we tested it: optimized and untouched pages on the same site
The cleanest test of whether optimization works would be a randomized trial: take one site, optimize half its pages at random, and watch. We found something close to that happening on its own.
Many sites optimize only some of their pages, usually because their plugin plan covers a limited number. That leaves optimized and untouched pages living side by side on the same website. They share the same domain, the same brand reputation, the same niche and the same author. The main thing that differs is whether a bot gets the optimized copy. That makes the untouched pages a built-in control group.
We used three major rules for this to ensure data quality.
A page only counts as optimized if its optimization finished before the observation window opened, so we never credit optimization for traffic that arrived first. Both groups are measured over the same 90 days, so neither wins by having been watched longer. And homepages are excluded entirely.
Homepages have no control group. Of the homepages in our data, 555 are optimized and 6 are not, because the homepage is the first thing anyone optimizes. They are also the most-visited URL on almost every site, carrying 53% of all the AI traffic optimized pages earned. Leaving them in would credit optimization for the fact that homepages are homepages. The six nobody optimized settle it: they earned 10,167 visits per 1,000 pages, slightly more than the 8,074 optimized homepages earned. Homepages pull AI traffic either way.
That exclusion costs us most of the sample, and it is the honest trade. A site that only ever optimized its homepage has nothing left to compare once the homepage is removed, and 444 sites are in exactly that position. What remains is 116 websites that optimized real inner pages while leaving comparable inner pages untouched: 108,834 pages, 22,969 optimized and 85,865 untouched.
One property of that sample affects the continued research: site sizes are wildly uneven. The median site contributes 183 pages; the largest contributes 60,343, which is 55% of every page in the study. So any statistic that pools all pages together is, in effect, a statistic about that one customer's page inventory. We report the pooled figures for completeness, but the primary result below is measured site by site, where every website counts once.
The result: optimized pages earned 11x the AI referral visits
The question we set out to answer was not just whether an optimized page ever gets picked up. It was how much AI traffic it actually earns. So we counted every referral visit, not just whether a page had one.
Optimized pages earned 173.5 AI referral visits per 1,000 pages. Untouched pages on the same websites earned 15.8. That is a factor of 11, across 108,834 pages and 90 days.
The gap comes from two things happening at once, and they are different mechanisms. Optimized pages got picked up at all far more often, 4.47% of them against 0.59%. And the ones that did get picked up earned more visits each, 3.88 against 2.66. Most of the work is getting a page into the answer set in the first place.
It also shows up site by site, not just in the total.
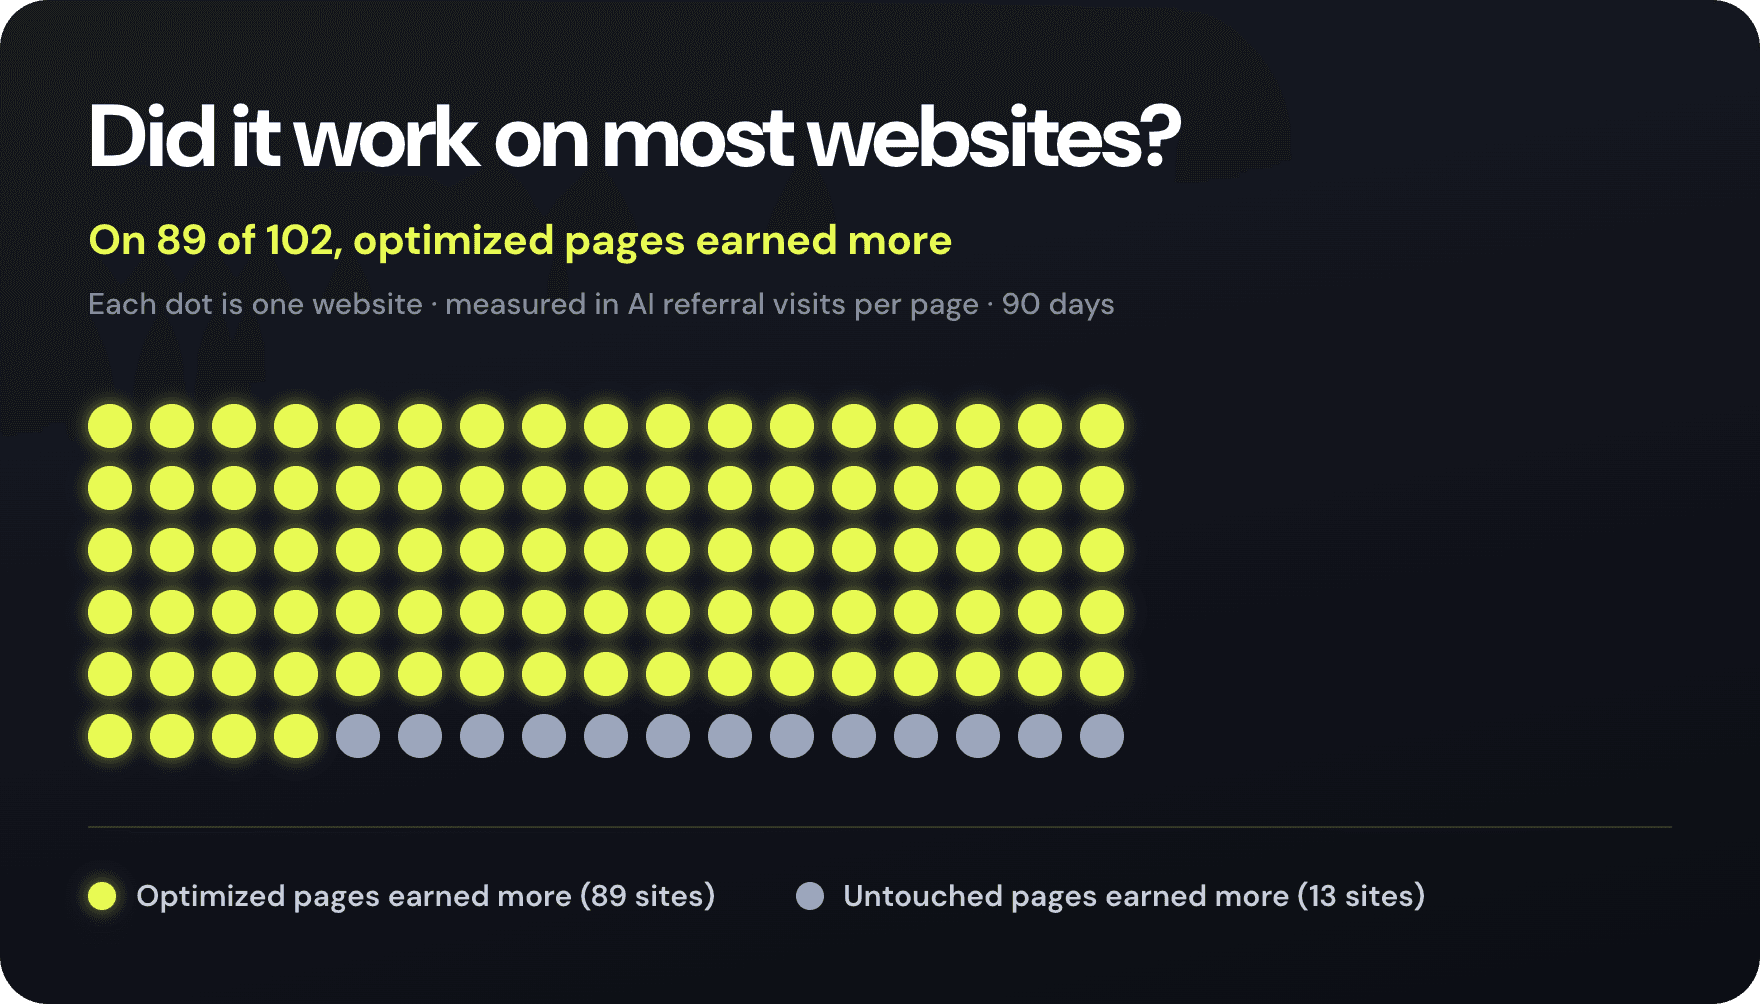
Optimized pages came out ahead on 89 of the 102 websites that received any AI referral traffic at all. Thirteen went the other way. Whatever else is true, this is not one lucky customer carrying the result.
Does it only work on a site's best pages?
There is an obvious objection remaining. The plugin does not optimize pages at random. It ranks every page on the site with an internal importance score, built from site structure and internal linking, and works down from the top until the plan's page allowance runs out. So the optimized group is, by construction, weighted towards a site's more important pages, and those are the pages likeliest to attract AI traffic anyway.
That is a predictable confound. Because the division is made by score rather than by taste, we know exactly what separates the groups and can hold it constant: group every page by its importance tier, then compare optimized against untouched pages within the same tier.
| Page priority | Untouched | Optimized | Volume lift |
|---|---|---|---|
| Low | 39.0 | 37.4 | none |
| Medium | 2.2 | 66.9 | 30x |
| High | 13.2 | 100.9 | 7.7x |
| Top priority | 69.6 | 428.6 | 6.2x |
The same comparison on the simpler question, whether a page was cited at all:
Share of pages that earned an AI referral visit · 90 days
Were these pages already winning before we touched them?
Tier controls only go so far. The sharper question is the one an analyst asks next: were these pages already winning before you touched them?
The cleanest answer would be a before-and-after on the same pages. We cannot give you one, and it's because referral tracking only starts when a site installs the plugin, which is roughly when its pages get optimized. Only 8 of the 116 sites in this study recorded any AI referral before their first optimization, and between them those 8 logged 57 clicks. That is far too thin to build a baseline on. We cannot rule out that optimized pages were already outperforming.
What the data does support is a comparison the plugin's own queue hands us for free. Optimization works down an importance ranking, so at any moment a site has pages the algorithm has selected but not yet reached. Those pages were picked by exactly the same rule as the treated ones. If selection were doing the work, they should already look like winners. Every group below sits on the same sites, over the same 90 days.
AI referral visits per 1,000 pages · 90 days
Traffic rises with how long a page had been optimized. The importance score, which is what decides which pages get optimized, does not: the partway group scores lower than the never-optimized group (9.1 against 9.5) and still earned nearly five times the traffic.
Two things in that table matter more than the headline ratio.
Pages the algorithm had already chosen, but had not yet optimized, earned nothing. If the ranking simply identified pages that were going to be cited anyway, this row would not be zero. It is a small group, 617 pages, so treat it as supporting rather than decisive.
The middle row is the strongest single piece of evidence in this study. Pages optimized partway through the window earned 76.1 per 1,000, roughly four to five times the never-optimized group, while carrying a lower average importance score than that group, 9.1 against 9.5. Less important pages, more traffic, with treatment as the difference. Selection cannot produce that ordering. Traffic tracks how long a page had been optimized, not how good the page was to begin with.
That is not a randomized trial and we are not going to call it one. It is a dose-response pattern that a pure selection story does not predict.
What optimization actually changes on the page
Across the completed optimizations in our system the plugin has logged more than 660,000 individual changes. They fall into six kinds, and all six ship together on every page, which is the first thing to say about attribution: this study cannot tell you which one earned the traffic, because no page in it received one change in isolation.
Nested JSON-LD is added so a model can confirm what the page is, who published it and what it covers without guessing from layout. Meta titles and H1 tags are rewritten. Body copy is reordered so the answer comes first instead of after four paragraphs of throat-clearing. A short summary is added near the top for models that only read the opening. A FAQ block is generated, both visible on the page and in schema. And headings are rewritten as the questions they answer. Alongside those six, the site itself gets an llms.txt file telling crawlers what the site is for and which pages matter.
We can say something about the last one, because headings are the only change the optimizer scores individually, on a 1-to-10 scale for how clearly a heading signals what sits beneath it. Across every heading it has touched the average moved from 5.12 before to 8.87 after. That is a measure of what the optimizer did, not proof that headings caused the traffic. Treat it as the change we can quantify rather than the change that mattered most.
The logic behind it is simple enough. An AI engine cannot match a question to a heading that is not recognisably about anything. Real examples, with customer names removed:
| Before | After | Clarity |
|---|---|---|
| Say Hello | What is the phone number for the studio? | 4 → 9 |
| THANK YOU | How can I download The Complete Guide to Battery Maintenance? | 1 → 9 |
| 2010 - Present | What has the advocate's role been from 2010 to present? | 2 → 9 |
| Step 1 | What is the first step to start your financial independence planning? | 4 → 9 |
| Keeping It All In Perspective | How do we keep all home inspection findings in perspective? | 4 → 9 |
Every "before" here is fine for a human. You can see the phone number sitting under "Say Hello." A model scanning for which page answers "what is the phone number for X" has nothing to match on. The rewrite adds no information to the page. It makes the information already there addressable.
One page, before and after
Crista Cloutier runs The Working Artist, an online art program with hundreds of pages and an audience that already knew her: she has been featured on BBC Radio 4 and in HuffPost. The content was never the problem. One of her headings read like this.

Evocative, and completely opaque to a model. Nothing in it indicates what the page is about. After optimization, the bot-facing version reads:
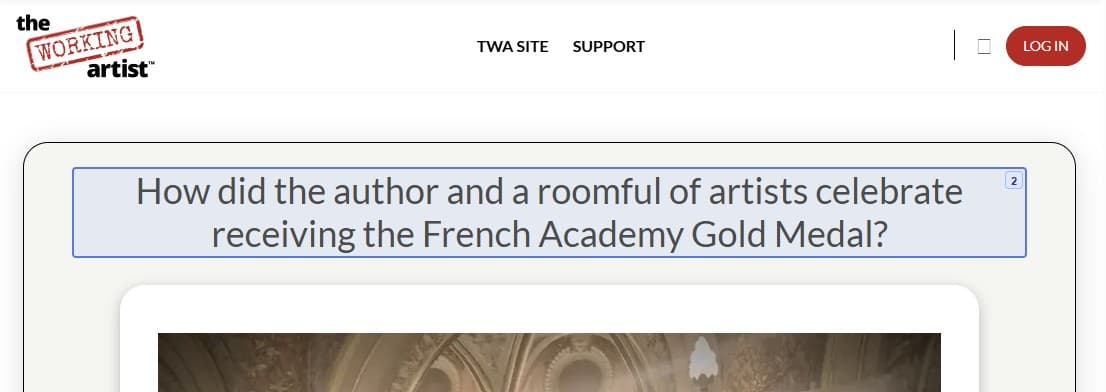
Same page, same story, same words for human readers, who still see the original. The difference is that a model now has something to match against a question. ChatGPT recommends her program first, and mentions of her work are up 120%. The full breakdown is in the Working Artist case study.
One site is an anecdote, not evidence, which is what the 116-site comparison above is for. It is here because it shows the mechanism the aggregate numbers can only imply.
Where AI search optimization does not work
Every headline number above points the same direction, which is a good reason to be suspicious. So here is what the data does not support.
It does nothing measurable for low-priority pages. Thin, deep-in-the-archive pages earned 37.4 referral visits per 1,000 optimized against 39.0 untouched. No gain at all.
We could not measure homepages, so this study says nothing about them either way. Almost every homepage in our data is already optimized, which leaves no untouched homepages to compare against. That is a gap in the measurement, not a finding that optimization fails there. Homepages pull AI traffic heavily regardless.
Most pages still get nothing, optimized or not. AI referral traffic is rare in absolute terms. 95.5% of optimized pages earned no AI visit at all in the 90 days we watched, and for untouched pages it is 99.4%. Optimization shifts the odds. It does not manufacture demand for a page nobody is asking about. If no page on your site is getting picked up at all, the problem is usually more basic, and there are clearer signs to check first.
It cannot make thin content authoritative. Optimization makes good content legible to a model. The content-depth pattern in our wider AI traffic research is just as strong as anything here, and it is not something markup fixes.
Methodology
Data source. First-party server logs and referral records from the LovedByAI WordPress plugin. Bot requests are recorded per site per day; AI referral clicks are recorded per landing URL. Nothing here comes from a third-party traffic estimator.
Corpus. 1,153 websites and 144.5 million bot requests between 10 July 2025 and 26 July 2026. Mostly small and medium business sites on WordPress.
Study sample. 116 sites that held both optimized and untouched non-homepage pages, covering 108,834 active pages: 22,969 optimized and 85,865 untouched.
Unit of analysis. The headline compares referral visits per page across all 108,834 pages in the sample. The per-site comparison is reported alongside it, counting each of the 102 websites with AI traffic once.
Observation window. 90 days from 27 April 2026, applied identically to both groups.
Definition of optimized. A completed optimization record for that page, finished before 27 April 2026. All at the plugin's standard level.
What we actually measure, and what we do not. Every number in this study is a referral visit: a real person arrived on a page from ChatGPT, Gemini, Claude or Perplexity, and our plugin logged it. We do not measure citations. A model can name your business, quote your page, and recommend you by name without anyone clicking through, and none of that appears anywhere in this data. Referral visits are a floor on how often you were cited, not a count of it, and the gap between the two is large and unmeasured. We use "referral visit" throughout rather than "citation" for that reason. Engine attribution reads both the UTM source and the referrer, because only ChatGPT stamps a UTM parameter reliably.
URL handling. URLs are normalized (scheme, www, query string, fragment and trailing slash dropped, then lowercased) and then de-duplicated to one row per site, because the same page is often discovered under several forms.
Homepage exclusion. Any URL with no path is dropped from both groups. 555 of 561 in-sample homepages were optimized against 6 that were not, so they cannot support a comparison, and they carried 53% of the optimized group's referral visits.
Headline metric. Total AI referral visits divided by total pages, computed separately for each group: 3,984 visits across 22,969 optimized pages (173.5 per 1,000) against 1,362 visits across 85,865 untouched pages (15.8 per 1,000). Ratio 10.9.
How to read the 89-of-102 count. The two groups are not the same size on a given site: the median site with traffic holds 126 optimized pages against 18 untouched. Because referral traffic is rare, a small group records zero visits more easily, so the per-site count is best read as evidence of direction and consistency rather than of effect size. The Wilson 95% interval on the raw proportion is 79.3% to 92.3%.
Robustness. The comparison was re-run with every page capped at 3 visits, which discards the tail entirely: optimized pages still led 78.8 to 9.7 per 1,000. Removing the five highest-traffic sites raises the ratio to 12.6.
Data quality. Every referral event in the window carries both a user agent and a referrer or UTM source. 245 of 32,199 events in the window, 0.76%, have a bot-like user agent string; they are retained, and removing them does not move any figure quoted here. Engine mix in the window: 86.1% ChatGPT, 7.4% Gemini, 3.4% Claude, 3.1% Perplexity.
Known limits. Observational, not randomized. No pre-treatment baseline exists, because referral tracking starts when a site installs the plugin. Pages are selected for optimization by the plugin's importance ranking, so the two groups differ systematically on importance by design, which is why the tier comparison and the dose-response comparison both sit alongside the headline. Referral counts undercount any engine that strips referrer data, and undercount organic mentions that never produce a click at all. Crawl figures and click figures are only compared over matched date ranges.
Revisions. This study first ran in July 2026 across 567 sites and 282,491 pages. Two corrections have been applied since. URLs are now de-duplicated per site, because the page table held roughly 23,000 duplicate rows for the same URL discovered under different forms, and duplicated URLs turned out to be about 4.6 times likelier than average to receive traffic. And homepages are now excluded: 555 of the 561 homepages in the original sample were optimized against 6 that were not, so they could not support a comparison, and they carried more than half the optimized group's traffic. Together those cut the sample from 567 sites to 116 and moved the headline from a 5.3x difference in the share of pages receiving traffic to an 11x difference in visits per page.
Reproducibility. Every figure above comes from one versioned set of SQL queries against our production database, so each refresh reruns identical definitions rather than a fresh hand-written analysis. If you are writing about this and want the query behind a specific number, ask us and we will send it.
What to do with this
If you take three things from the data, take these.
1. Spend your optimization budget top-down. An optimized top-priority page earns about 11 times the AI traffic of an optimized low-priority one, 428.6 per 1,000 against 37.4, and low-priority pages gained nothing from optimization at all. Whatever your plan covers, spend it on the pages that answer the questions your buyers actually ask.
2. Fix the headings before anything else. The largest share of what our optimizer changes is headings, and it is the change with the clearest measured effect. If you do this by hand, start by finding every heading on your money pages that would mean nothing to someone who cannot see the page, then rewrite it as the question the section answers. The fundamentals of AI search optimization cover the rest.
3. Track ChatGPT first, and separately. It is 86.8% of AI referral clicks. Optimizing for a balanced field of four engines misreads the market, and if your analytics files these visits as direct traffic, you will conclude nothing is happening while it is.
The pages that get cited are the ones AI engines can read cleanly and trust. To see how yours look to a model right now, run one through our free AI search checker: it scores your structured data, heading structure and answer-first formatting, then tells you what to fix first. If you would rather see the full crawl-to-click picture behind this study, that is in our AI traffic research.